In the notification area of the desktop, the overview now also shows some basic data of the hardware monitoring. This gives you a quick overview of the following data at any time:
- Uptime: Elapsed time since the firewall was started
- CPU: Average utilization of all CPUs in percent
- RAM: Usage of the main memory in percent
- var Partition: The usage of this partition is used here because data for logs or statistics are stored on this partition, among other things.
Figure 1.
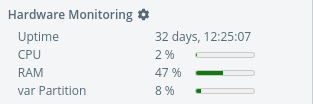
Note: Click on the title to go directly to the section Hardware Monitoring.